Oseremen Umolu

text below image
oseremen-portfolio
Data Analysis
Technical Skills: Python, SQL, Tableau, Power Bi, Excel, Data Entry, Database Management Systems
Soft Skills: Communication Skills, Time Management, Adaptability, Critical Thinking, Problem Solving
Links:
linkedin.com/in/oseremen-umolu-a6153899/
https://github.com/Oseumolu/
Education
-
M.S., Real Estate and Valuation Abubakar Tafawa Balewa University, Bauchi (_ In progress_) -
B.Tech., Real Estate and Valuation Abubakar Tafawa Balewa University, Bauchi (February 2017)
Work Experience
Team Supervisor And Data Analyst (03-2022 - 05-2023) Golden Sand Mining Company
- Managed data collection and analysis efforts, ensuring accurate and timely data reporting for decision-making purposes.
- Conducted regular team meetings to discuss project objectives, safety protocols, and performance goals, ensuring all team members were aligned and informed.
- Prepared comprehensive reports and presentations based on data analysis findings, facilitating informed decision-making for management.
- Ensured compliance with safety regulations and company policies, promoting a safe working environment for all team members.
- Managed project timelines and deadlines, coordinating activities to ensure projects were completed on schedule.
- Oversaw the training and development of team members, providing guidance and support to enhance their skills and productivity.
- Collaborated with the management team to develop and implement operational
- strategies that improved workflow processes and reduced operational costs.
- Maintained inventory control and procurement processes, optimizing the
- availability of necessary supplies and equipment for the team
Head Of Operations And Data Analyst (02-2019 - 05-2021) Jabico Farm
- Analyzed operational data and performance metrics to identify areas for improvement and implemented corrective actions accordingly.
- Led and supervised daily operations within the workplace, ensuring the smooth execution of tasks and projects.
- Collaborated with the data analysis team to extract valuable insights from operational data, contributing to data-driven decision-making.
- Fostered a culture of teamwork, accountability, and continuous improvement among the operations team.
- Collaborated with department heads and team leaders to develop operational strategies and plans that aligned with the organization’s goals.
- Implemented process improvements to enhance workflow and productivity, reducing operational costs and increasing output.
- Oversaw the allocation of resources, including manpower, equipment, and materials, to optimize operational efficiency.
- Resolved operational challenges and issues promptly, utilizing problem-solving skills and collaboration with cross-functional teams.
Projects
Customer Segmentation Analysis
- This project involves a thorough examination of customer data to uncover meaningful segments within the customer base.
- The goal is to identify distinct groups of customers with similar characteristics or behaviors, enabling the company to tailor marketing strategies and messages to each segment.
- The outcome of this analysis is likely to include insights into customer preferences, purchase patterns, and demographics, which can be leveraged for targeted marketing campaigns.
Sales Performance Forecasting
- In this project, a predictive model is developed to forecast sales performance.
- The model utilizes historical sales data and potentially other relevant factors to provide forecasts that guide inventory management decisions.
- Accurate sales forecasts are crucial for ensuring that inventory levels are optimized, reducing overstocking or stockouts, and improving overall business efficiency.
Website User Behavior Analysis
- This initiative revolves around the analysis of user behavior on a company’s website.
- The objective is to gain insights into how visitors interact with the website, which pages they visit most, and where they drop off in the conversion process.
- By understanding user behavior, the company can make informed changes to the website’s design and content to enhance the user experience and increase the likelihood of conversions (e.g., making a purchase, filling out a contact form).
Market Analysis for Residential Property Development
- This project focuses on conducting a comprehensive market analysis to evaluate the feasibility of a residential property development project.
- It likely involves studying factors such as local real estate trends, demand for housing, competition, regulatory considerations, and potential risks.
- The outcome of this analysis will inform the company’s decision regarding whether to proceed with the development project and how to position it effectively in the market.
Commercial Property Lease Optimization:
- In this project, lease agreements and occupancy data for a portfolio of commercial properties are analyzed.
- The goal is to optimize the utilization of available space within the properties.
- This could involve identifying underutilized areas, renegotiating leases, or making recommendations to maximize revenue and efficiency in the commercial property portfolio.
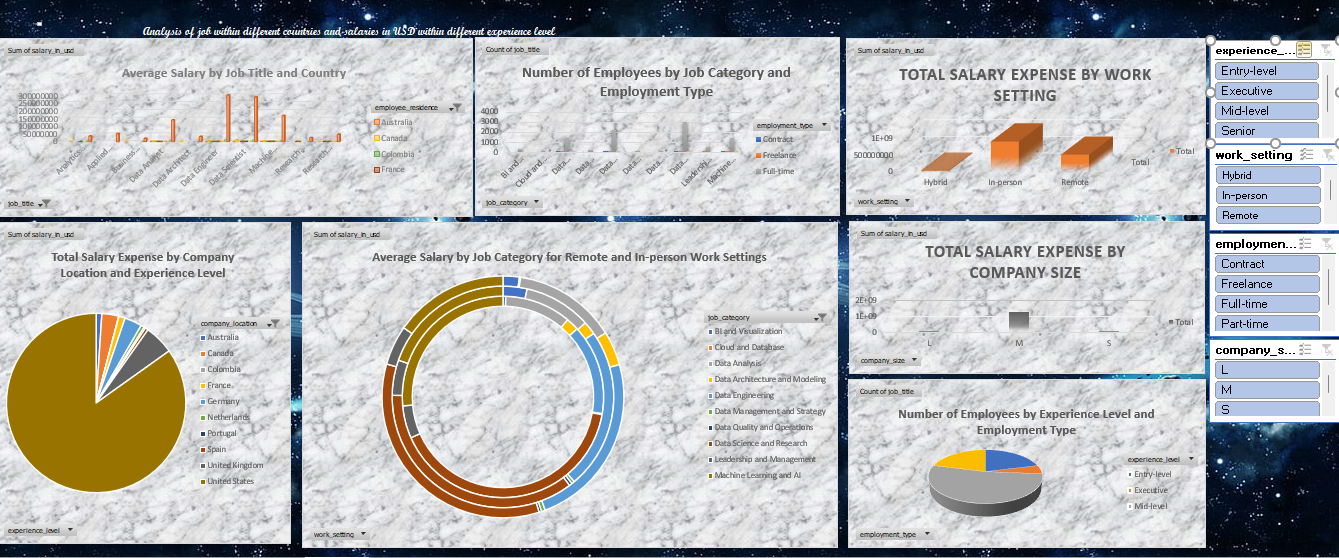
Jobs in Data Analysis:
This EDA provides valuable insights into the distribution and characteristics of data-related job positions across different countries, job categories, experience levels, and company sizes. Further analysis could involve examining the relationship between variables such as salary and job category, or exploring trends over time. Overall, this dataset offers valuable information for understanding the landscape of data-related roles in the global job market.
largest companies by revenue
This list comprises the world’s largest companies by consolidated revenue, according to the Fortune Global 500 2023 rankings and other sources. American retail corporation Walmart has been the world’s largest company by revenue since 2014.
The list is limited to the top 50 companies, all of which have annual revenues exceeding US$130 billion. This list is incomplete, as not all companies disclose their information to the media and/or general public.
Out of 50 largest companies 20 are American, 19 Asian and 11 European.
.png)
Stock Price Prediction App Report
Purpose:
The Stock Price Prediction App is designed to forecast the closing prices of Microsoft Corporation (MSFT) stock using historical price data. It utilizes a linear regression model, a common statistical method for predicting continuous outcomes. Data: The app loads historical stock price data from a CSV file named ‘MSFT.csv’, which includes daily opening, high, low, and closing prices, along with the trading volume.
Functionality:
Data Visualization: The app displays the stock price data and provides a scatter plot visualization comparing actual vs. predicted closing prices using Plotly.
Model Training:
It splits the data into training and testing sets, with 80% used for training the linear regression model.